
We often discuss the Lincoln property market through house prices.
Yet long before price comes a home’s character. And long before its character comes its age.
Every town or city has its own housing fingerprint. Not just streets and postcodes, but a layered history of building booms, social change, and shifting design. Lincoln is no different.
Lincoln has 44,581 homes, according to the Valuation Office. Breaking them down by period built reveals a pattern that becomes even more interesting when compared to the national picture.
Pre-1919
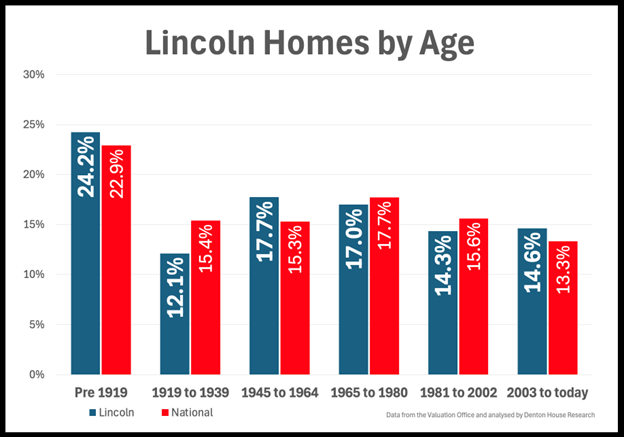
In Lincoln, 10,805 homes were built before 1919. That represents 24.2% of the housing stock.
Nationally, 22.9% of homes fall into this pre-1919 bracket.
In the towns and cities, these are the Victorian and Edwardian properties. Terraces sit near town centres. Streets were shaped by industrial expansion and agricultural heritage. They tend to form the historic heart of an area. The Georgian homes bring high ceilings and large windows, whilst the Victorian red brick terraced homes with their solid walls and slate roofs, often need ongoing maintenance.
1919 to 1939
Lincoln has 5,398 interwar homes, accounting for 12.1% of its housing.
Across the UK, 15.4% of homes were built during those same years.
The interwar period was defined by suburban growth. Semi-detached homes with circular bay windows and large gardens built on tree-lined avenues were the popular choice. A shift towards owner occupation and planned estates. In some areas, this era accounts for a substantial share of the housing stock. In others, it plays a more modest role.
These homes still sit in established neighbourhoods reflecting their era.
1945 to 1964
In Lincoln, 7,901 homes were built in the immediate post-war years. That is 17.7% of the total.
Nationally, 15.3% of homes were built between 1945 and 1964.
Britain faced a severe housing crisis with over a million homes destroyed and many more damaged. This led to a period of intense, government controlled “rationing” of housing until 1954, during which materials were limited and new builds were restricted to public, low-density, or temporary structures. It was only from 1954 that private builders began building en masse, after rationing ended. The semi-detached home was still the home of choice, often with generous plots yet a more straightforward ‘plainer’ design (when compared to pre-war semis). Over the decades, many have been extended, remodelled and modernised.
Comparing local and national proportions highlights the distinct ways each area experienced post-war expansion, emphasising the contrasts between their growth patterns.
1965 to 1980
7,568 Lincoln homes were built in the late 1960s and 1970s, comprising 17.0% of the housing stock.
Across the UK, 17.7% of homes date from this period.
The late sixties and seventies reshaped many communities. Estate building accelerated. Layouts evolved. Garages became standard. Cul-de-sacs and suburban sprawl became familiar features. In some local authorities around the UK, this era forms the backbone of modern housing supply. In others, it plays a smaller part.
1981 to 2002
Between 1981-2002, 6,392 homes were built in our local authority, being 14.3% of the housing stock.
Nationally, the figure stands at 15.6%.
These homes are seen as established but still modern by many buyers. Double glazing and cavity wall insulation became standard. Building standards improved. Layouts began to match modern living. These homes balance space and efficiency.
2003 to Today
Since 2003, Lincoln has added 6,517 homes. That is 14.6% of its housing stock.
Nationally, 13.3% of homes fall into this post millennium bracket.
These are the most recent developments. Built under tighter regulations. Designed with improved energy efficiency in mind. Often shaped by modern buyer expectations around kitchens, bathrooms and open plan living, yet at the expense of larger gardens.
Why Ageing Property Matters
Understanding the age profile of an area helps explain more than you might think.
Age shapes maintenance needs. It influences energy performance. It affects layout, garden size, and parking. It also shapes how buyers see certain streets or estates.
Most importantly, it gives context.
Lincoln is not defined by just one building era. It is defined by many. When you compare each age band with the national average, you see how unique the local housing really is.
If you ever wonder where your Lincoln home fits in this story, or how the housing mix shapes today’s market, I am happy to discuss it with you.
If you are thinking about selling and want an honest, evidence-based opinion on your Lincoln home’s actual market value, with no fluff, no pressure, and no nonsense, I would be delighted to help.
To ensure ALL our clients get the absolute best experience, and a total marketing strategy as unique as their homes, we only list twenty properties per month, our March & April market appraisal slots are now available to book, we ensure that you are always a name and not just a number, with Walters.